About the Creator
Lars Larson graduated from IUPUI with a Master's Degree in Media Arts & Science, with an emphasis on using data visualization to create virtual reality environments.
From a very young age, Lars has loved learning about science, history, and cultures. In elementary school his favorite television programs were Jacque Cousteau documentaries, "Connections" with James Burke, and "NOVA." As a youth he lived in the Philippines, where he learned a language and became comfortable in another culture.
Lars also loves the outdoors, having done a bit of backpacking, kayaking, and camping. He takes his camera on every trip. "I love being out and doing things, but for me, it's about the image. It's important to have good visual documentation," he says.
This project has allowed Lars to combine his interests in the outdoors, history, culture, photography, and visual media.
"I am excited to be able to combine so many of my interests into a project that is not only relevant, but beautiful. It has been a very interesting experience."
Lars lives in Avon, Indiana, with his wife and three children.
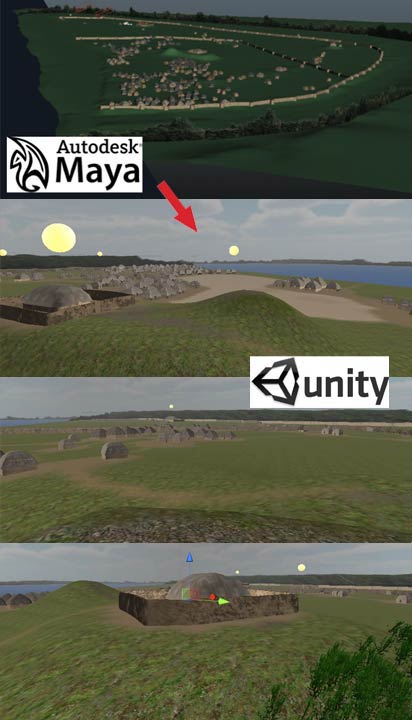
The Data Visualization Process
Original Data
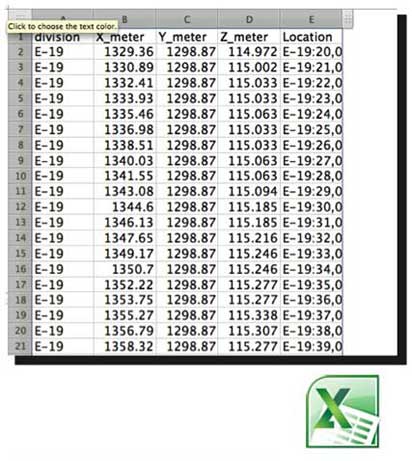
Dr. Glenn Black surveyed the site in 1939 under the WPA program. He took over one quarter million survey readings, and each of these readings was later put into a spreadsheet.
GIS Software
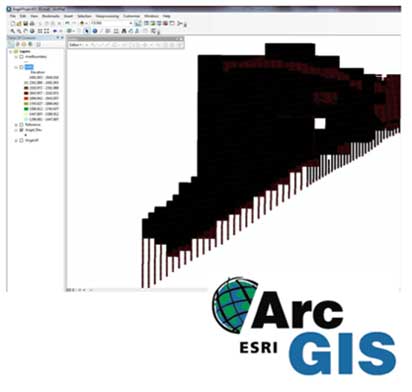
The spreadsheet was loaded into a GIS software program called ArcGIS, which converted all the data points into something called a “SHAPE” or .shp file. The .shp file is the basis for many types of analysis in GIS software.
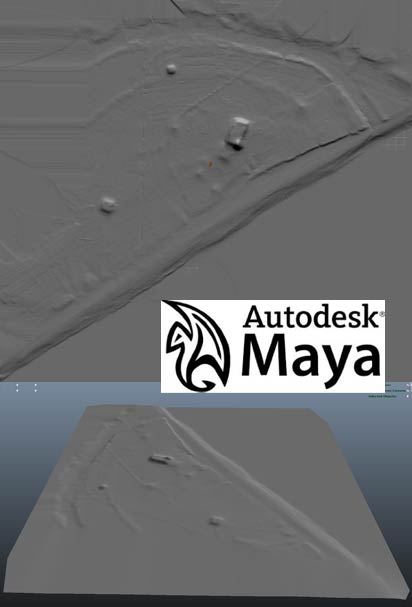
Heightmap
The SHAPE file was used in ArcGIS to generate a height map image. A height map is a type of contour map. Instead of contour lines, it uses shades of gray, with each shade of gray representing a separate elevation, the darkest (black) being the lowest point, and the lightest (white) being the highest point on the image.

3D Terrain Generation
The heightmap was then imported into a 3D modeling and animation software called Maya. Maya used the heightmap to generate three-dimensional geometry of the terrain as Dr. Black surveyed it in 1939.
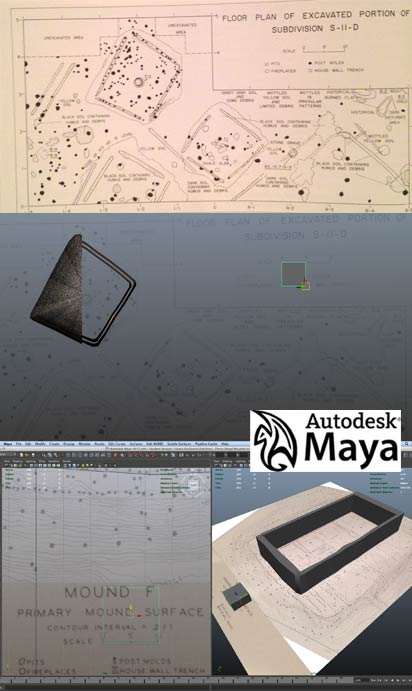
Buildings
Where possible, the buildings were matched to footprints of actual excavated building foundations. An image of the surveyed foundation was placed in Maya, and the building was modeled up from that.
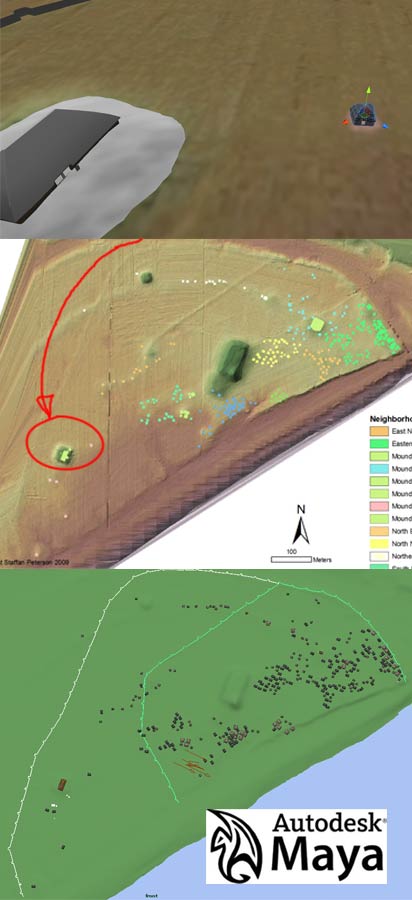
A magnetic survey done by Staffan Peterson in 2009-2010 shows where all buildings were. Model buildings were placed where where indicated by this survey.
Interactive Components
The scene, which was built in Maya, was then imported into a video game engine called “Unity 3D.” Here the final touches were added to the scene, such as fog, lighting, and vegetation. In addition, this is where all the interactive components were added, such as the ability to walk around in the scene, and the information panels.